The new integrated report of BASF is more than just numbers – it combines facts and figures with sustainability reporting best-ofs.
As a returning customer for years, BASF has placed its trust in nexxar once again, and the result speaks for itself: a sleek integrated report in blue, spiced up with videos, interactive graphics, small animations and a chart generator – just to mention only a few of the highlights. For the first time, BASF reported in accordance with the new ESRS guidelines. For this reason nexxar invented features for the sustainability statement such as ESRS-tagging, backlinks, and an on-page navigation to easily guide users through the client’s sustainability efforts.
-
Process
-
Services we provided
- Consulting
- Design concept
- Programming
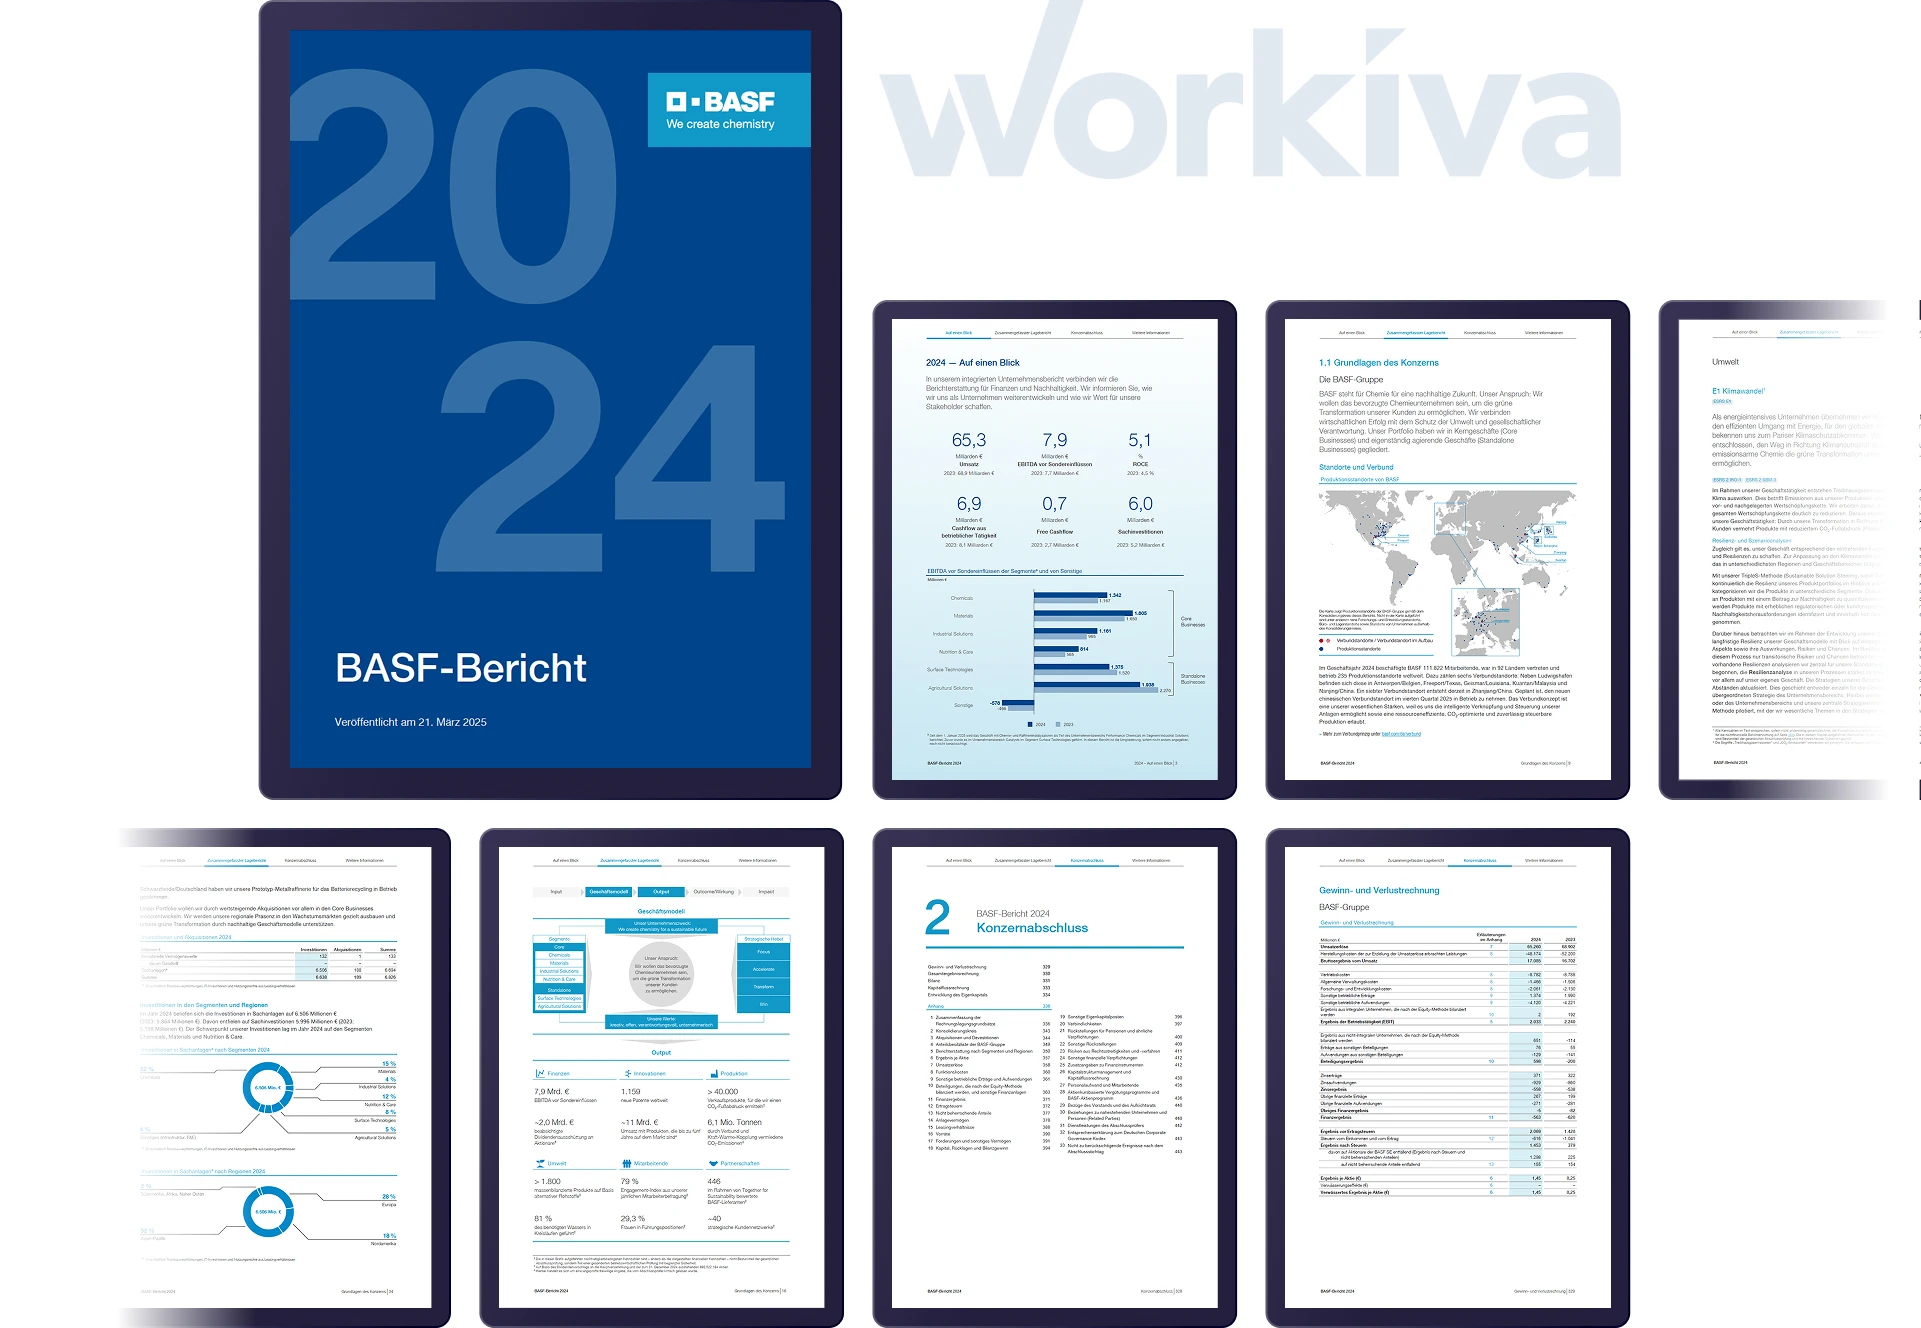
- Full PDF design in Workiva
-
Features
- Key figures comparison
- Glossary
- Interactive ESRS index and back-linking
- Tag manager
- Interactive graphics
- ESRS tags and word cloud
- On-page navigation for ESRS pages
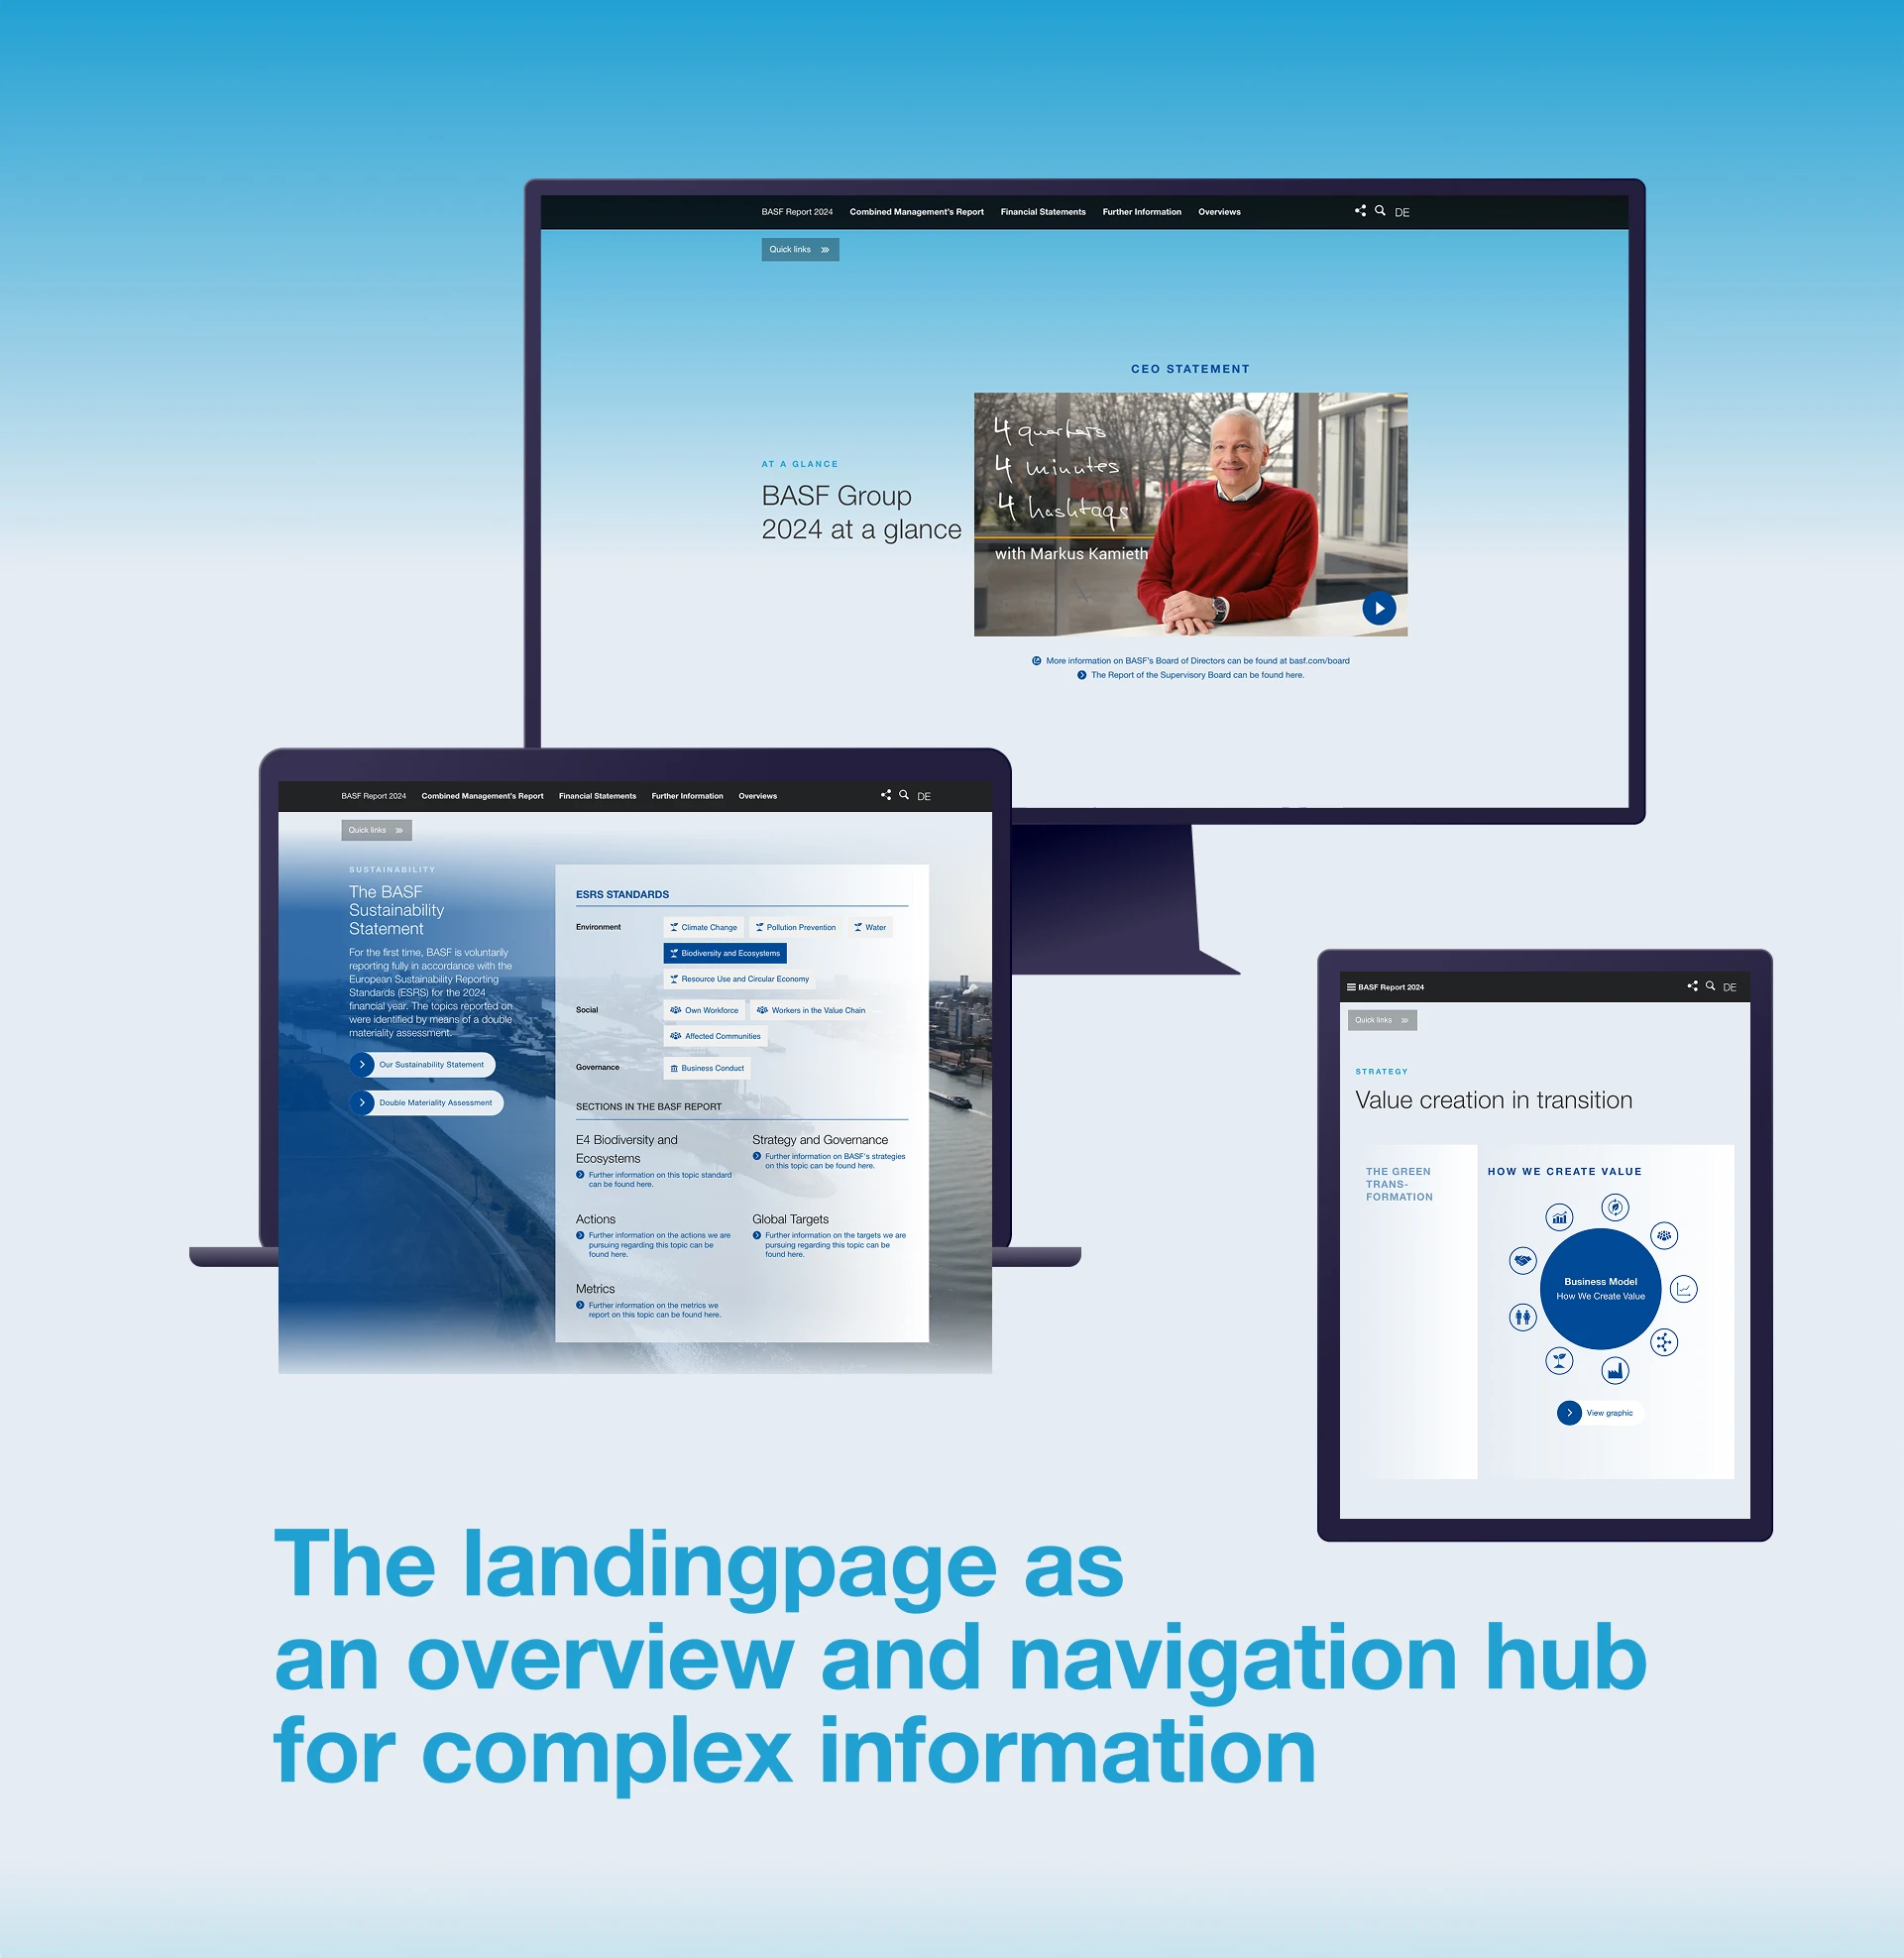
Landing page – First things first
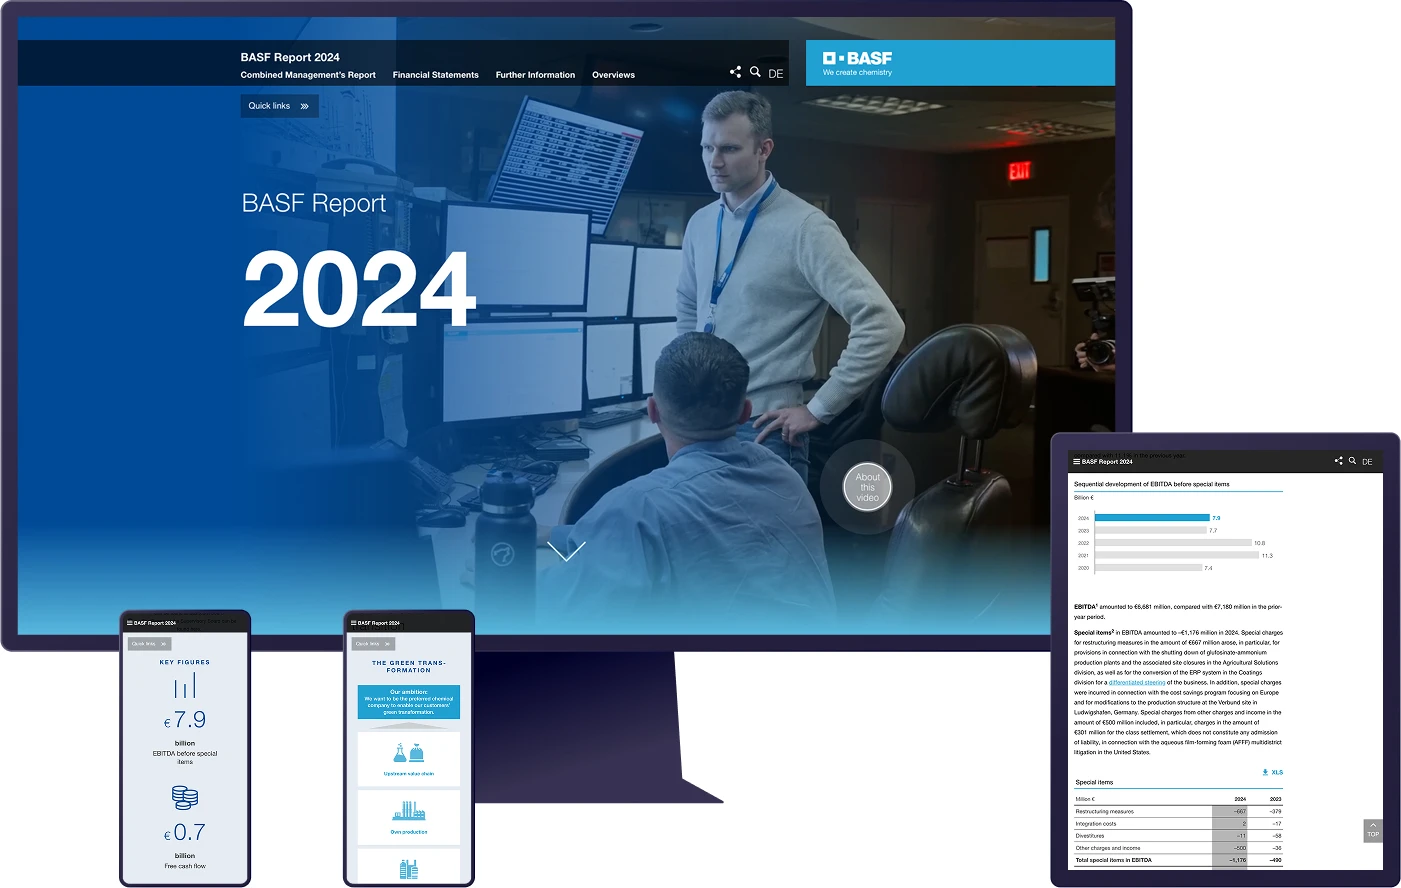
With many vivid elements, such as the header and the CEO videos, and animated key figures, the landing page is definitely an eye-catcher. The newly developed ESRS tag cloud gives an overview of the report’s ESRS content and helps users to dive directly into the sustainability statement. The „Strategy“ section leads users via quick links to the brand new, interactive green transformation graphic and the clickable value chain.
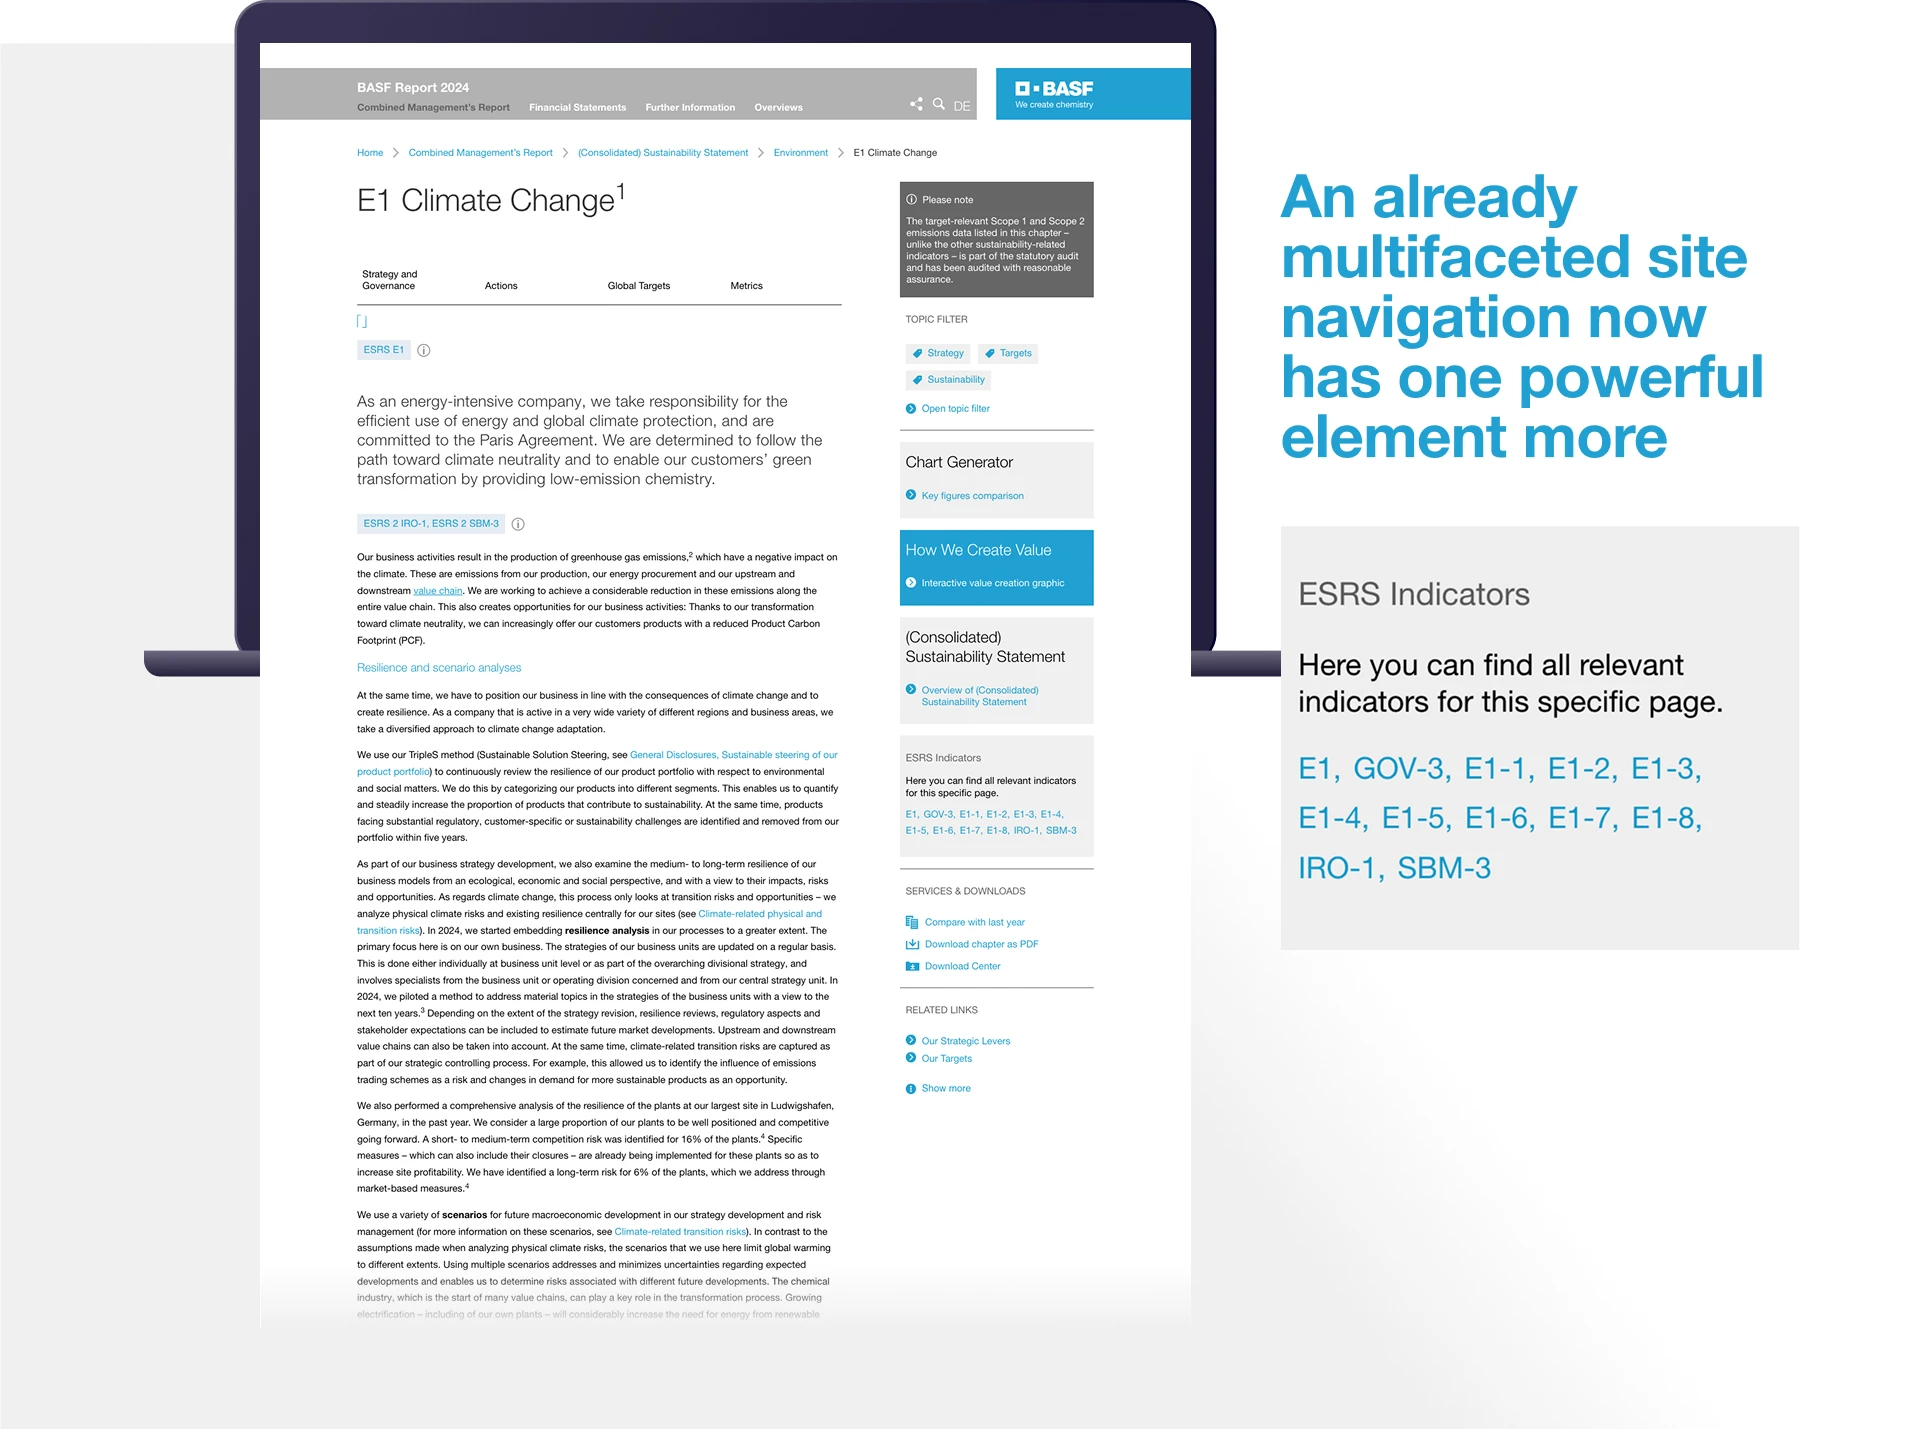
How to ESRS
BASF’s sustainability report is rather content-rich. To facilitate navigation on the voluminous sustainability-related pages, nexxar designed and implemented an on-page navigation that lets the users jump to their topic of interest. Additionally, there are also clickable ESRS tags on these pages, which contain additional information and a link to the ESRS index. The index gives the users an overview of all the sustainability-related topics that are covered in the report. It also links back to the respective content pages so further information can be found quickly.
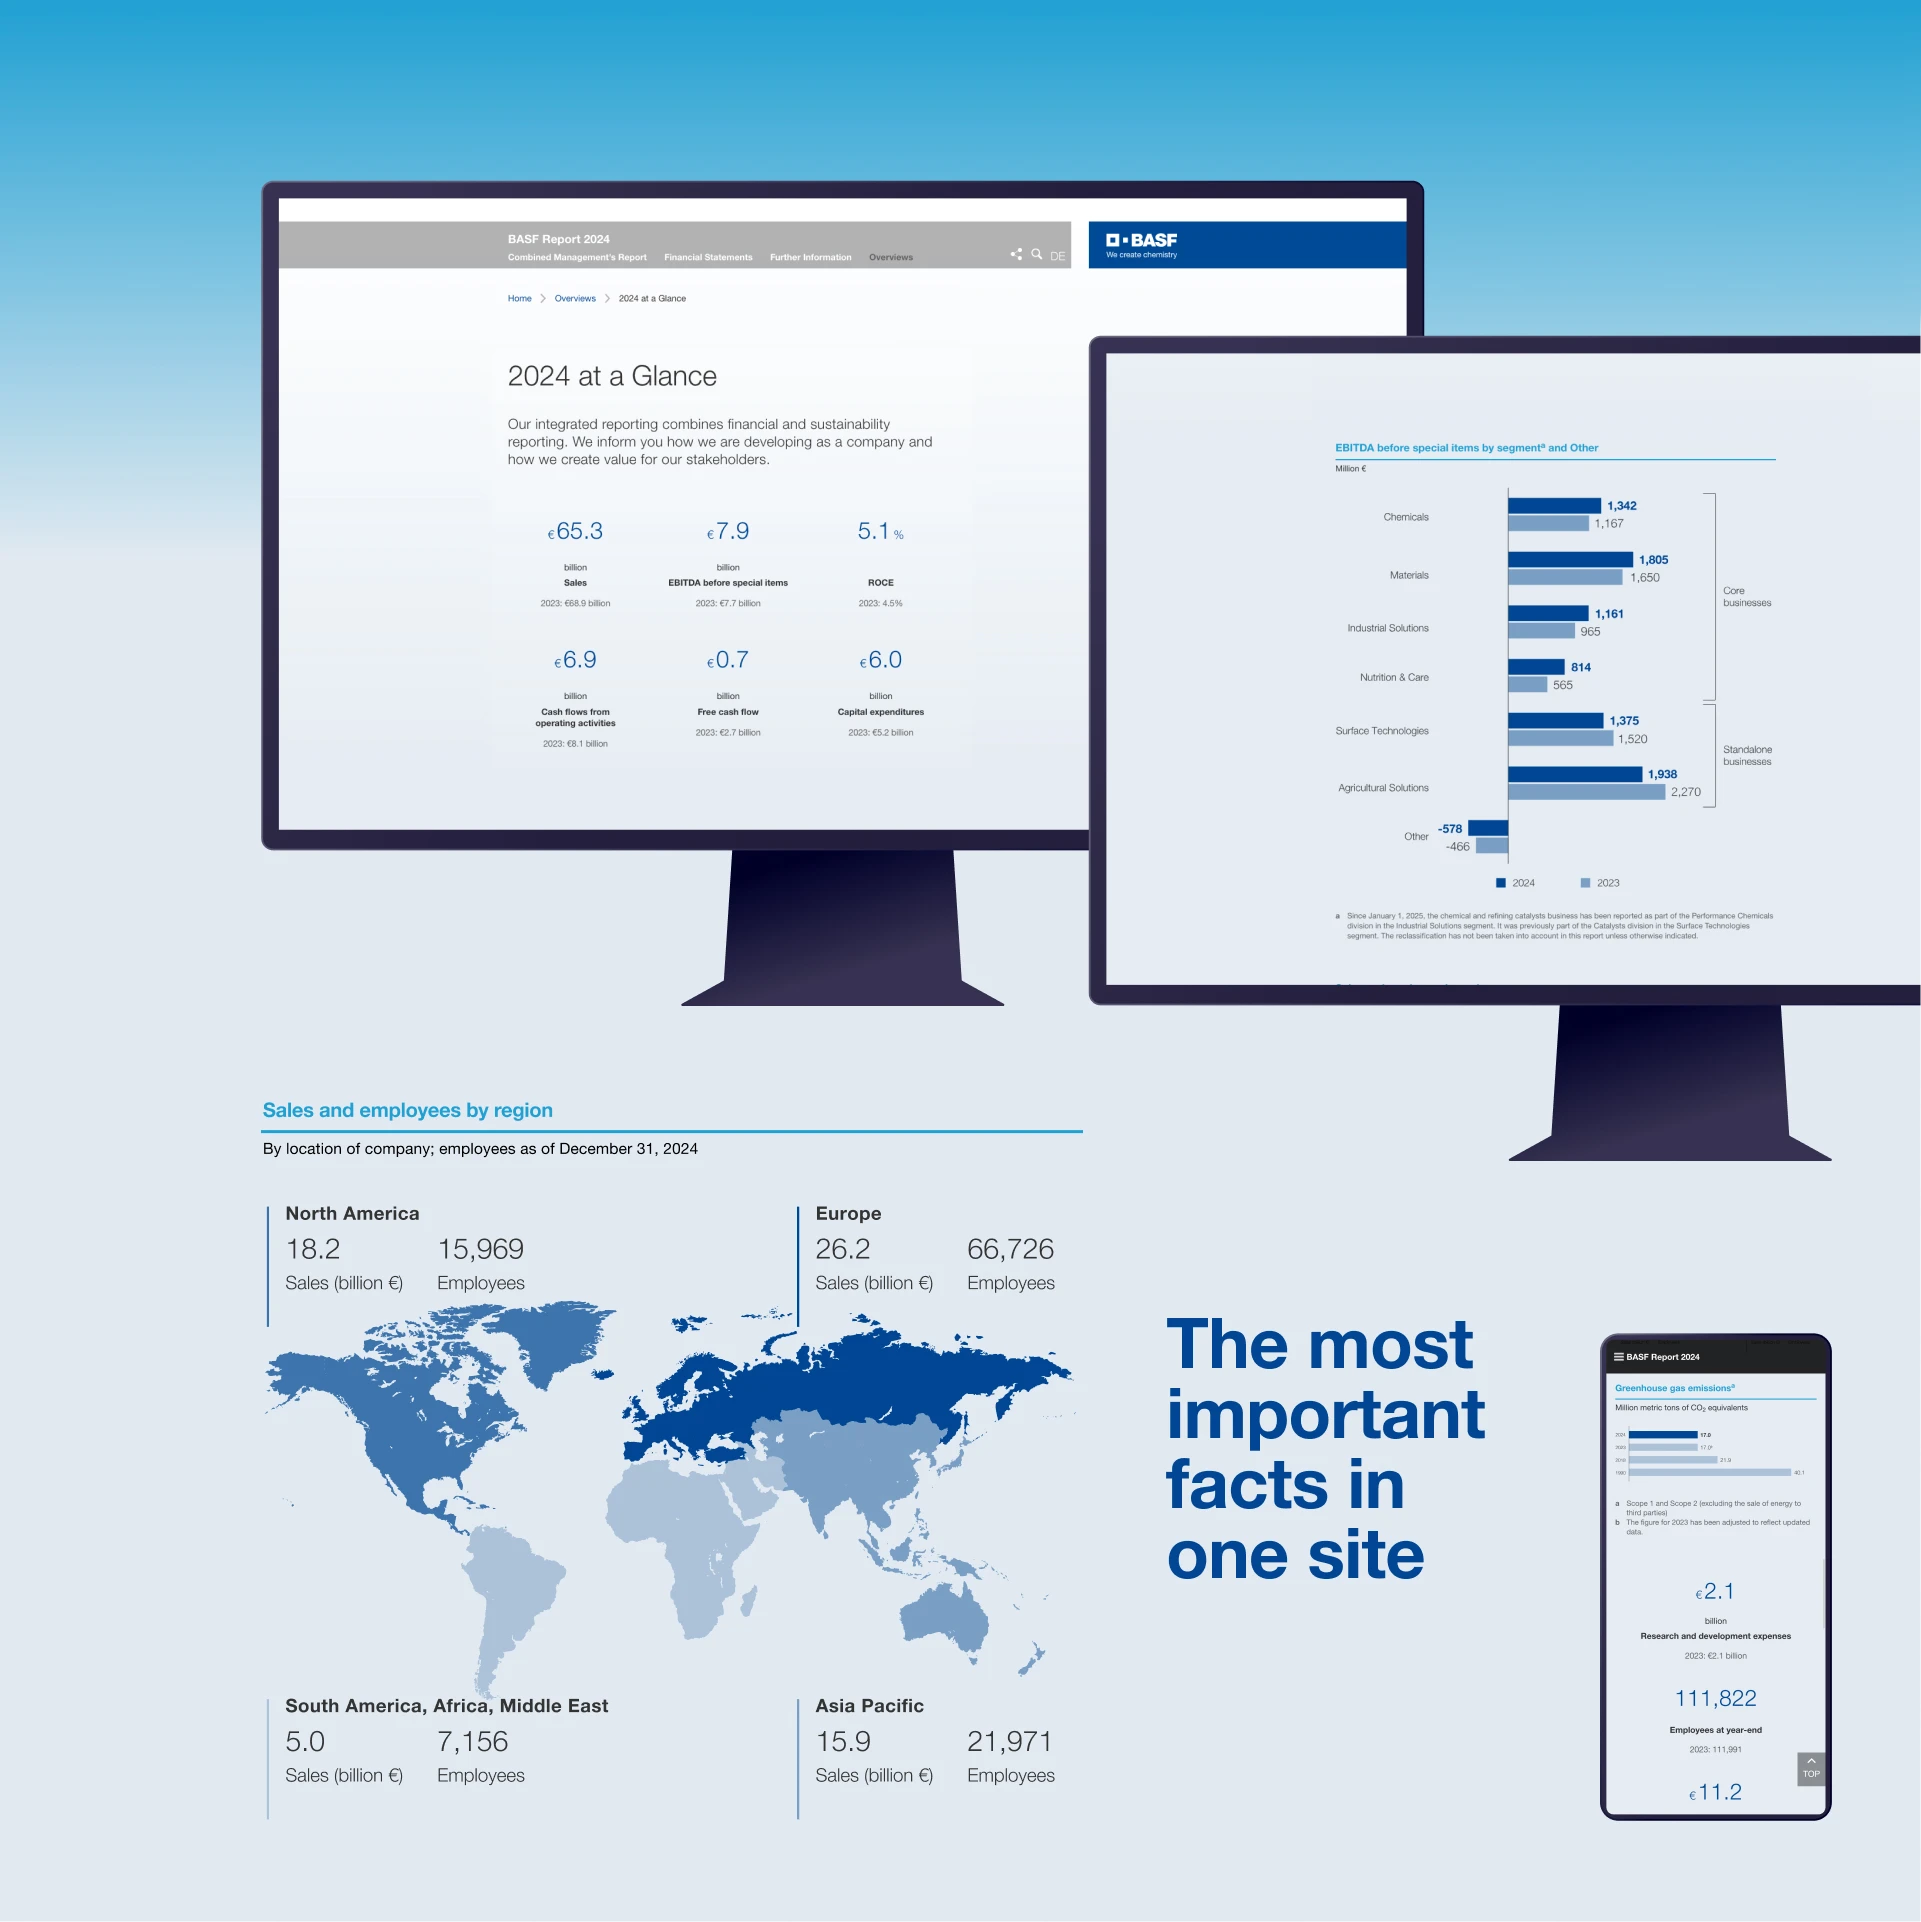
At a glance
To give users a quick overview of the most important facts & figures of the 2024 reporting year, nexxar developed a highly appealing “At a glance” page with animated key figures, bar charts and a world map for the online report. Its PDF counterpart is equally attractive.
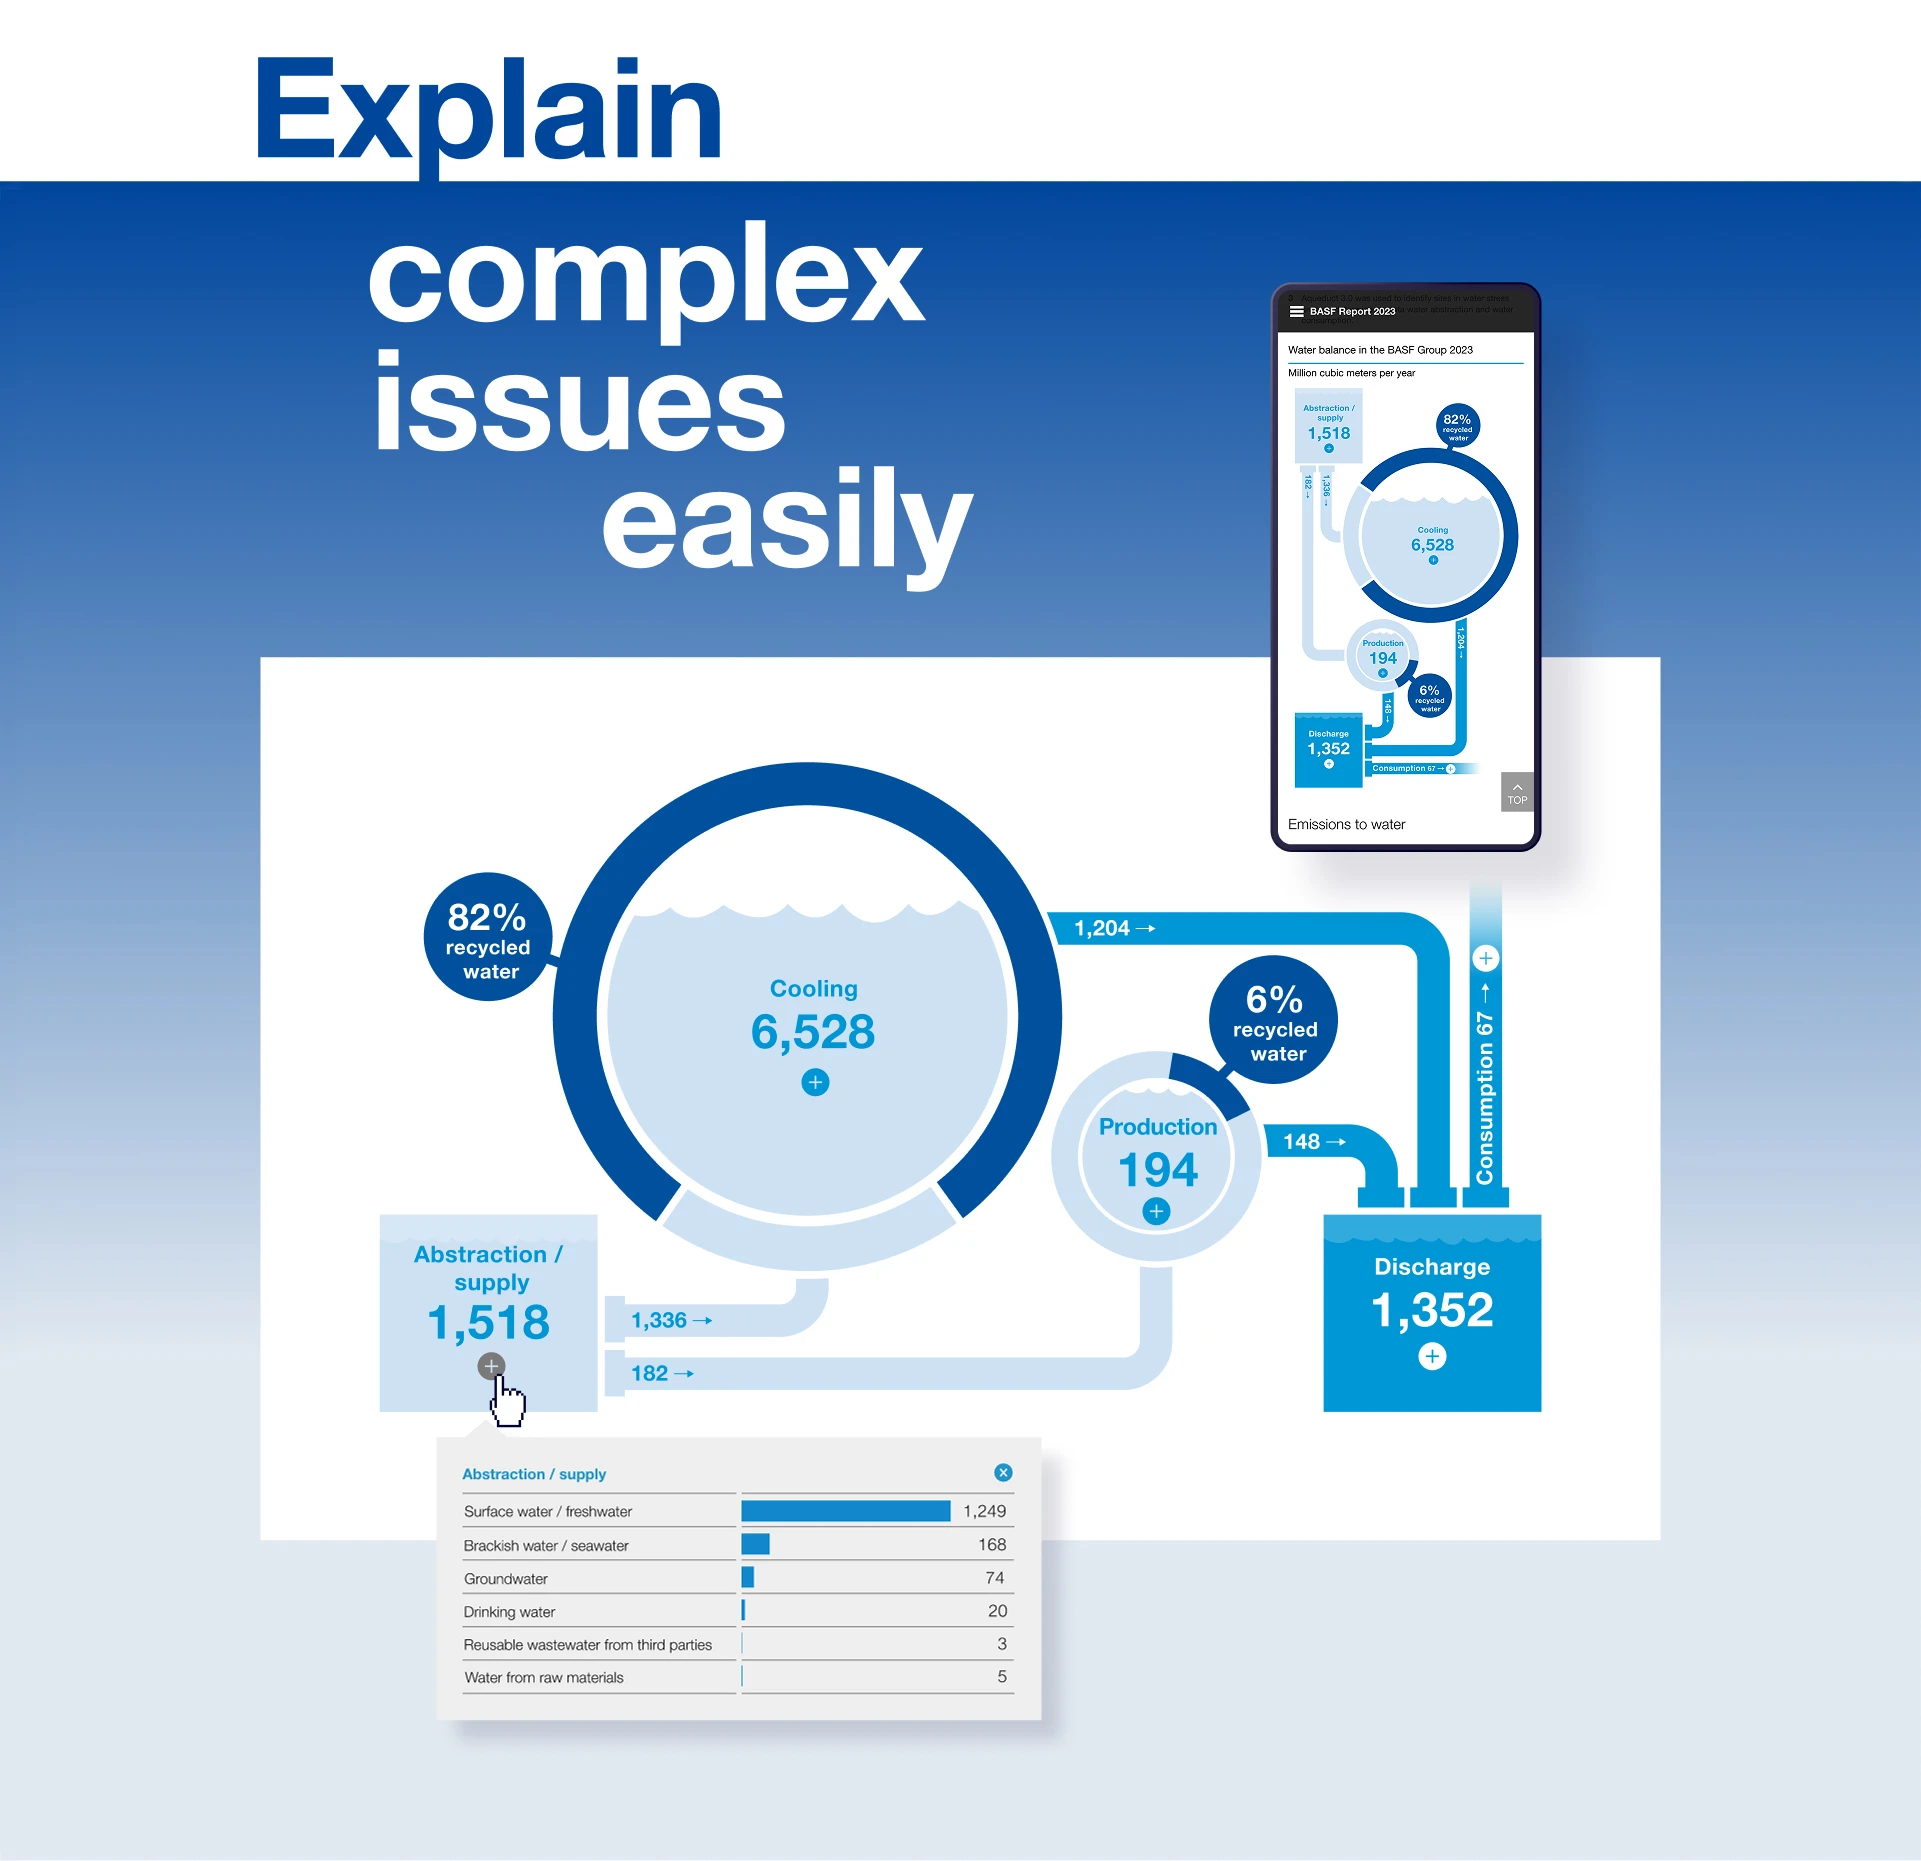
Interactive infographics
The updated business model is at the heart of the report and sums up the most important activities and goals of BASF in one interactive graphic. The facts & figures are loosened up by clickable icons and elements. The model in combination with the water consumption graphic enable BASF to communicate the complex information of its business activities and processes in an easily understandable way. The interactive graphics portfolio has been expanded this year by “The green transformation of our global value chain” graphic, which also works with illustrative elements and is enriched with detailed information.
Workiva meets nexxar
The PDF version of the report was completely generated in Workiva, for which nexxar developed the design that is harmonising with the online report. Even some of the most complex graphics, such as the business model, were created in Workiva and can be updated by BASF directly and continuously. To ensure a flawless PDF, nexxar took care of style and layout checks – the final result is worth seeing.