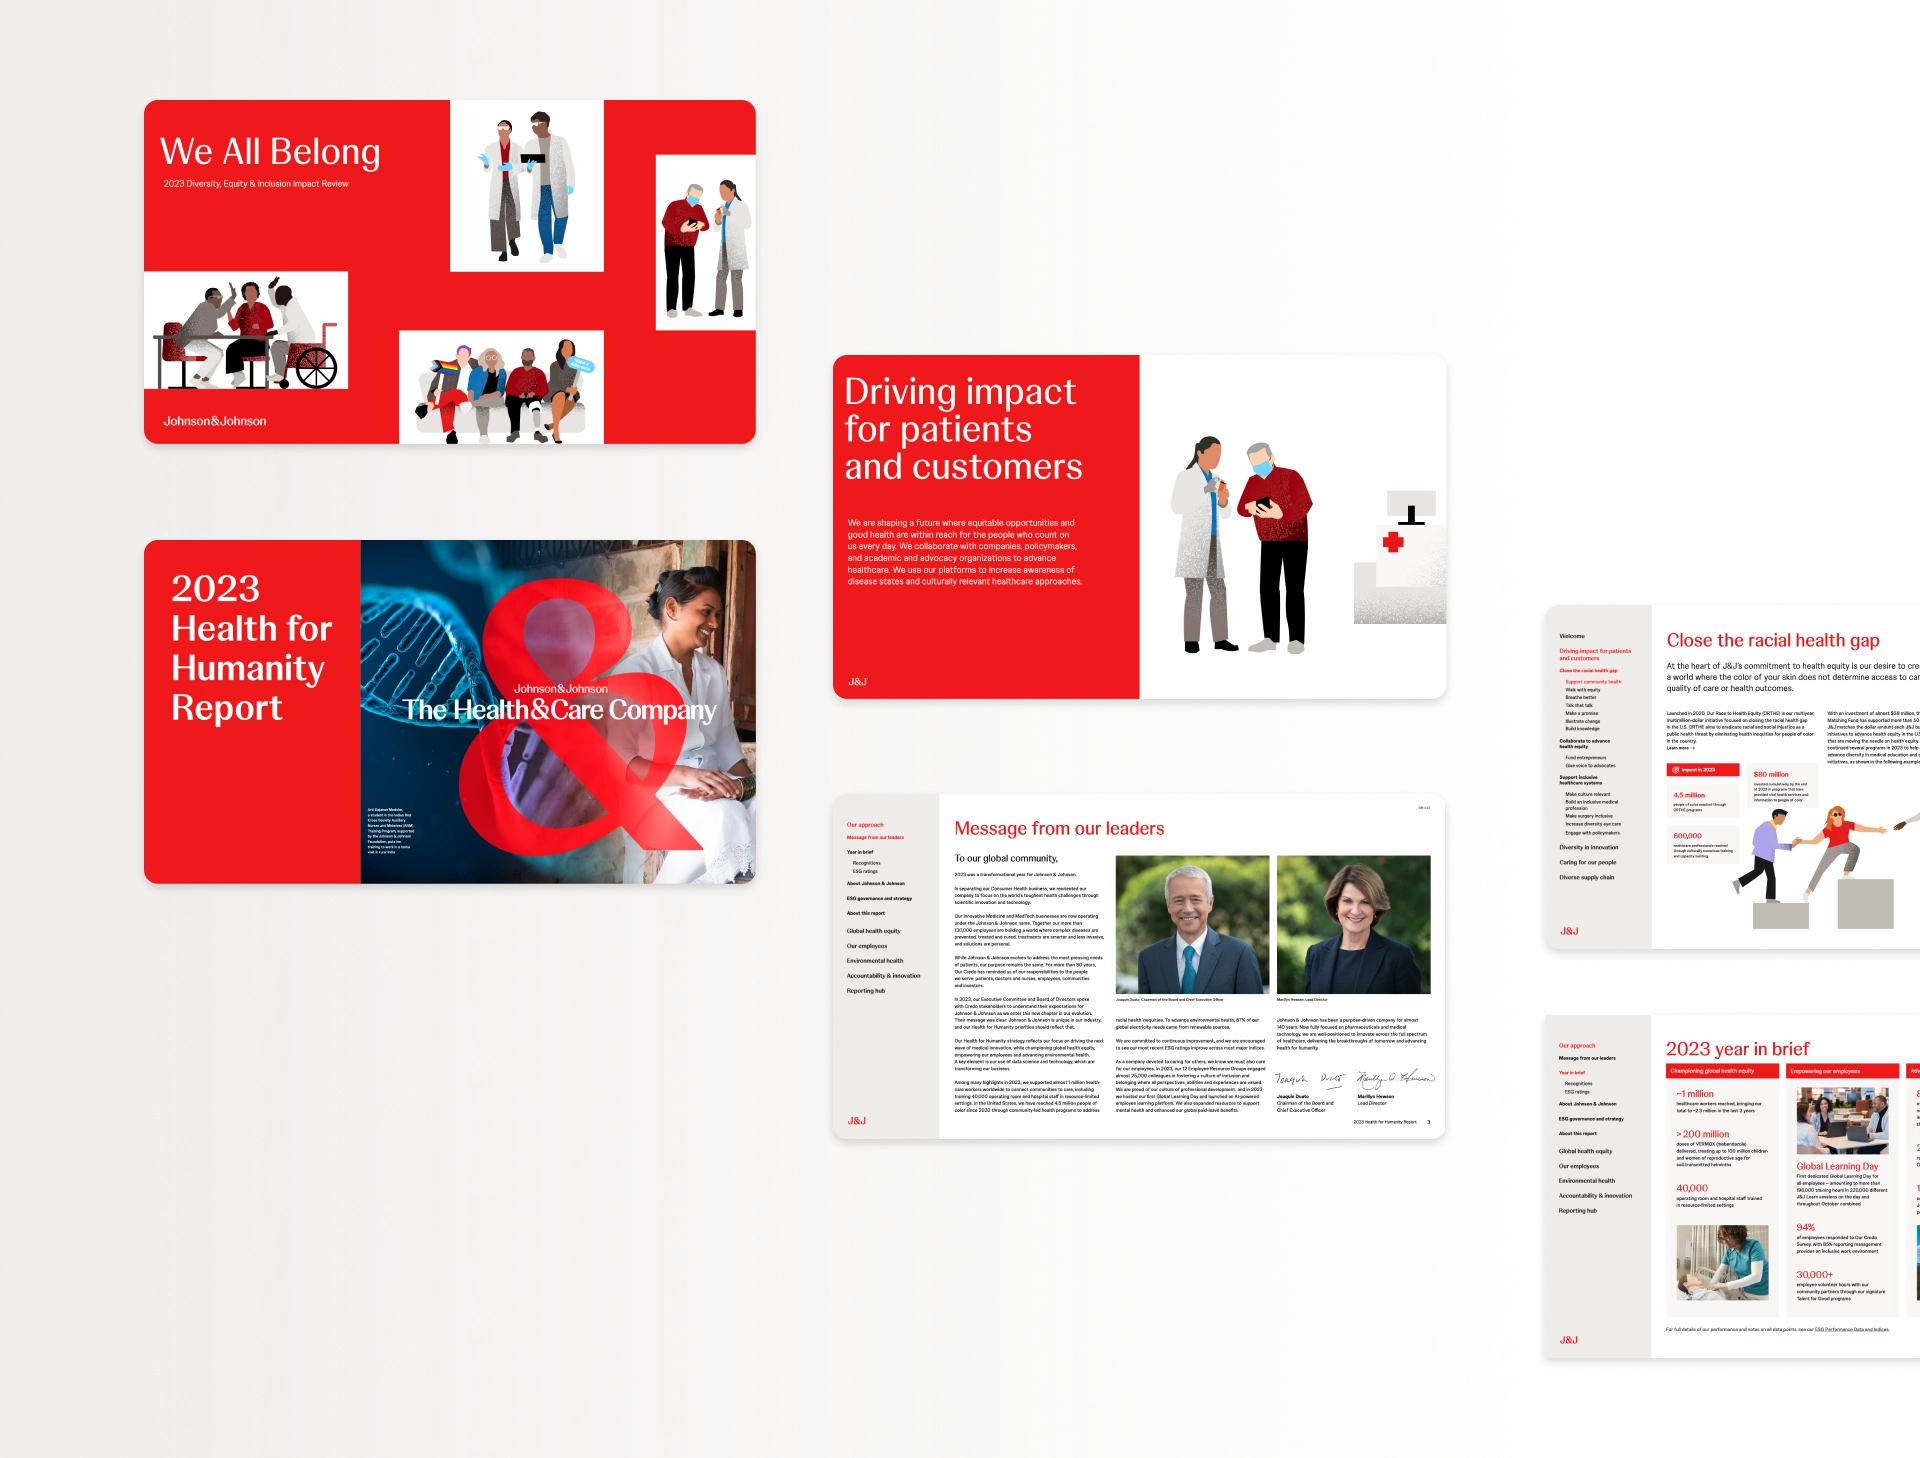
An appealing red landing page, vivid animations, and dynamic charts invite stakeholders to get informed about Johnson & Johnson’s progress and performance in environmental, social and governance matters. The 2023 Health for Humanity Report and the 2023 Diversity, Equity & Inclusion Impact Review inspire more than 130,000 employees of Johnson & Johnson and their partners to achieve their Health for Humanity 2025 Goals.
Johnson & Johnson requires highest standards in responsiveness, usability, accessibility, and compliance with their design guidelines. Based on the client’s previous reports, nexxar updated the media-specific design concept in line with the new corporate branding. Making use of the unique opportunities of online reporting, the content is presented in an aesthetic and dynamic way, delivering a great experience to users and complying with accessibility standards.
-
Process
- Online on Top, PDF in InDesign
-
Services we provided
- Consulting
- Design concept
- Motion design
- Illustrations
- Programming
-
Features
- Topic filter
- Key figures comparison
- Interactive charts
- Animated illustrations
- Special pages introducing the leadership
- Dynamic milestones
- Glossary
- Filterable story archive

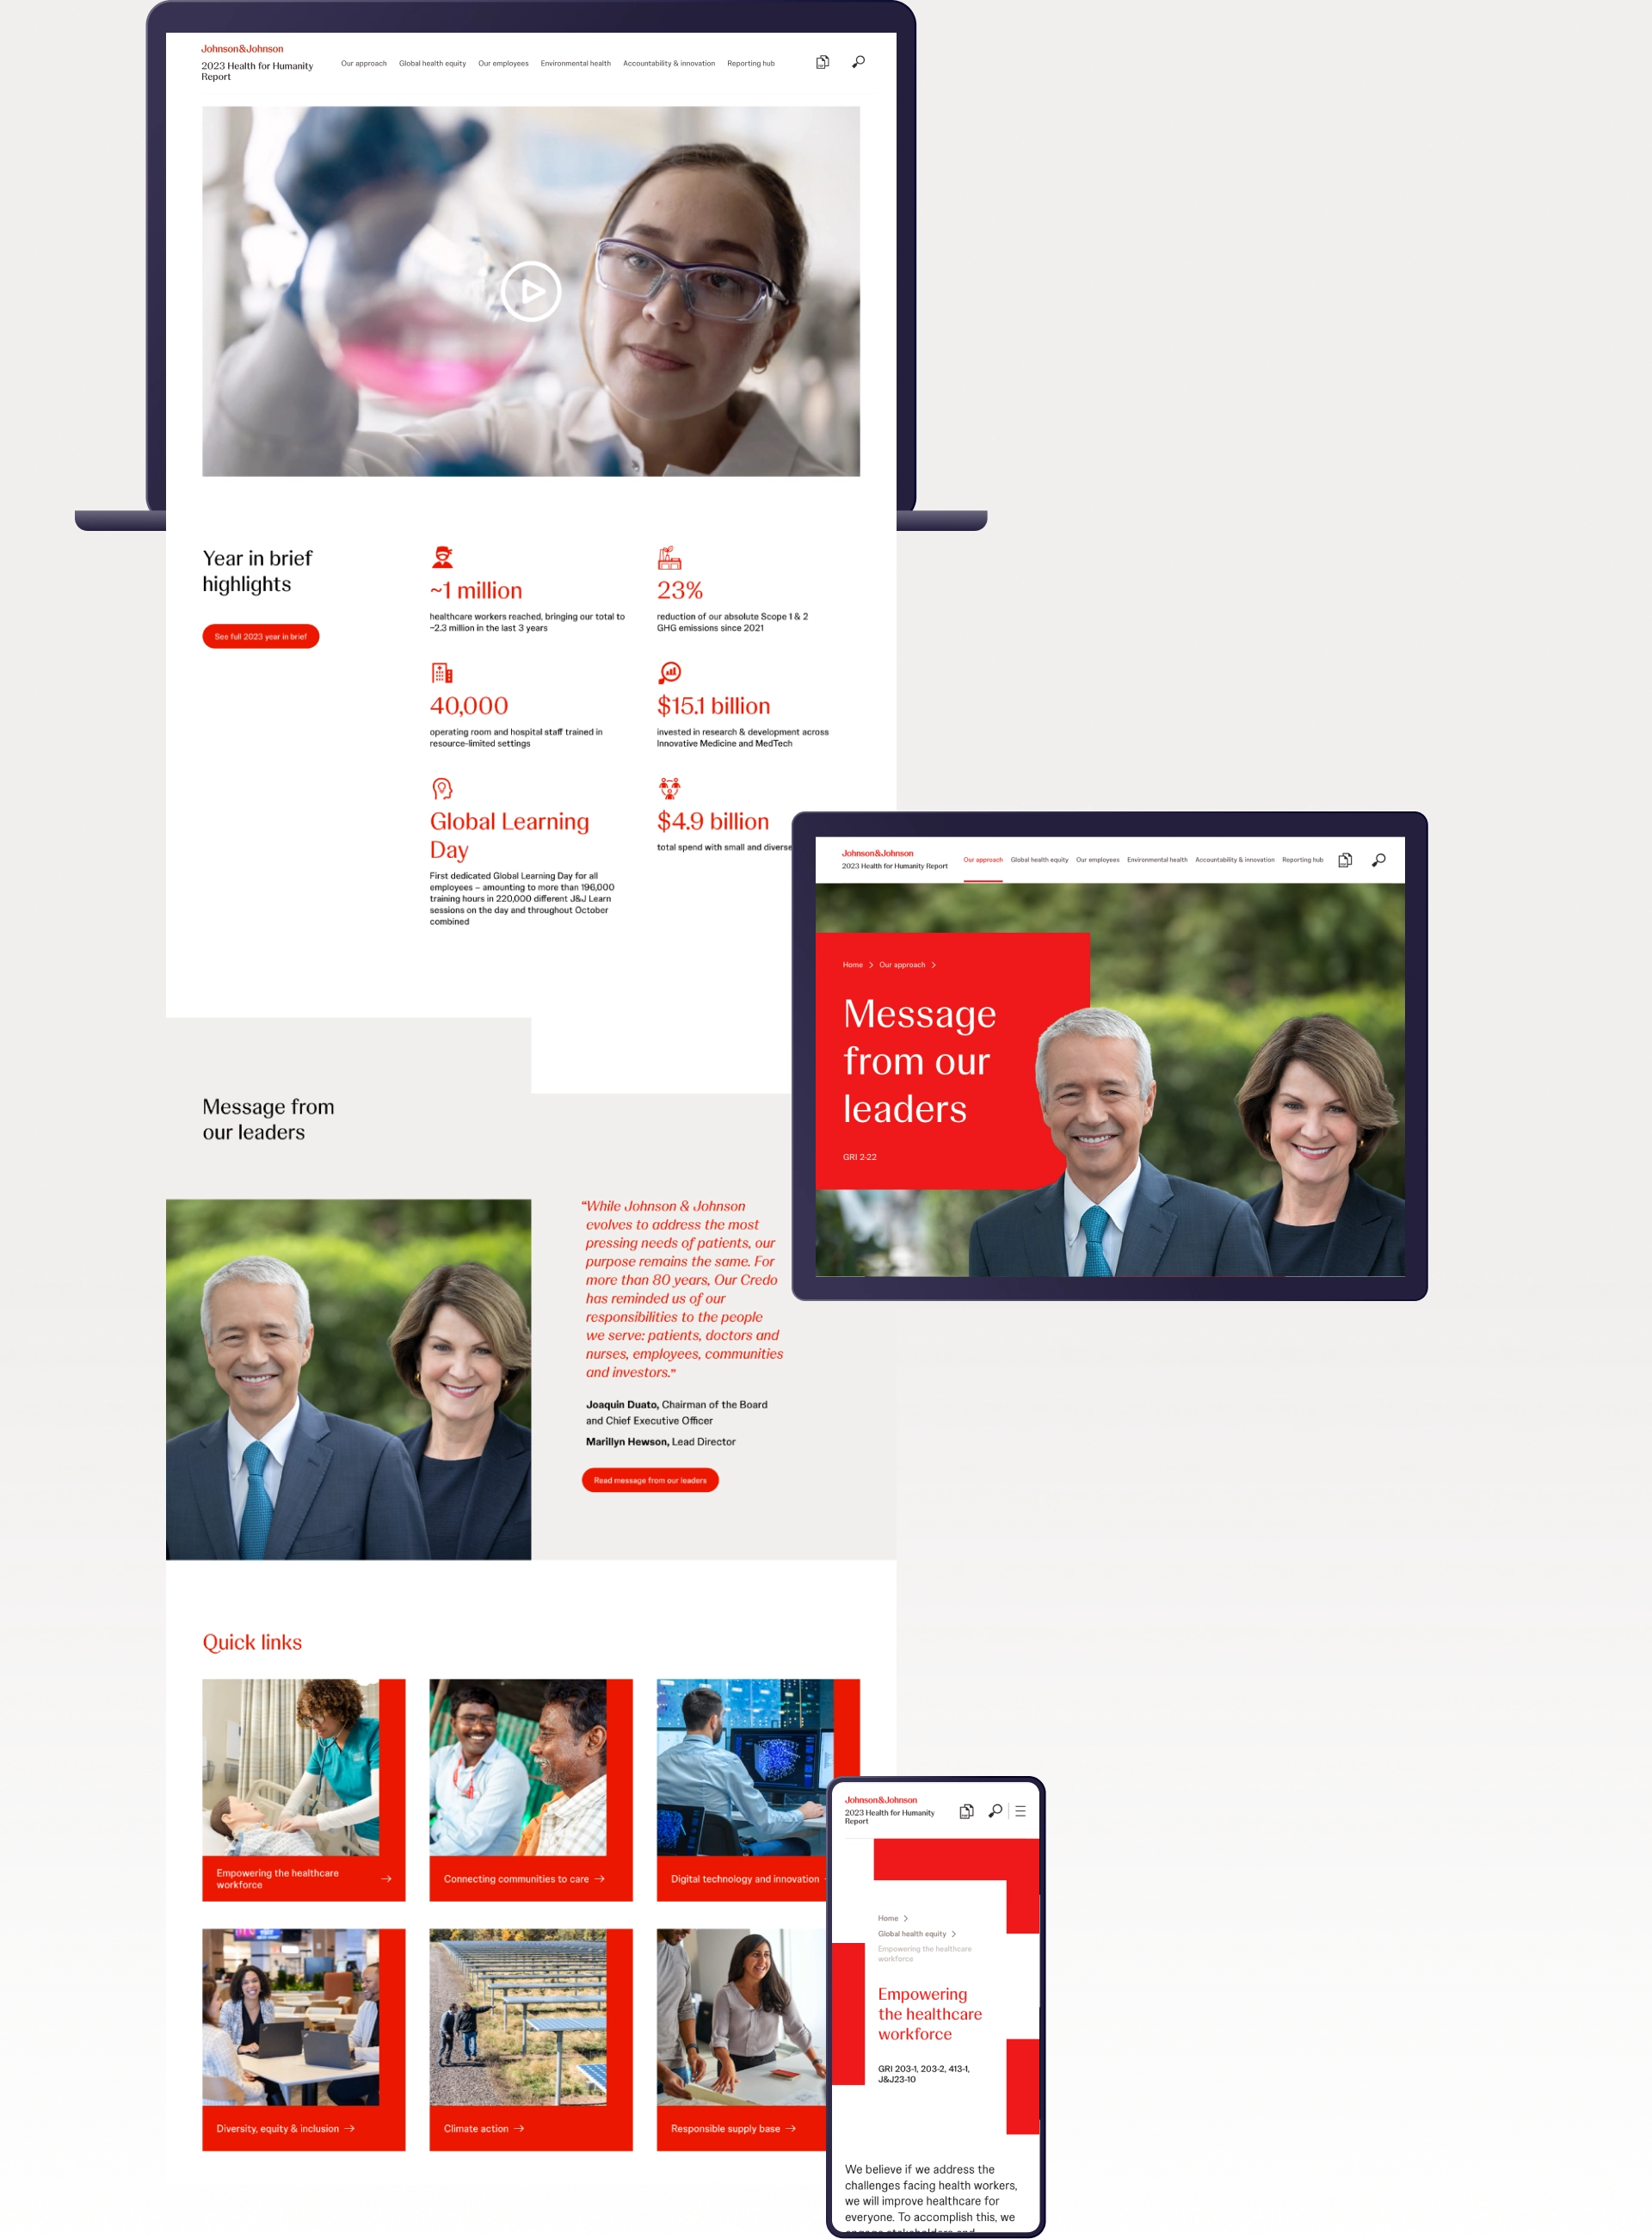
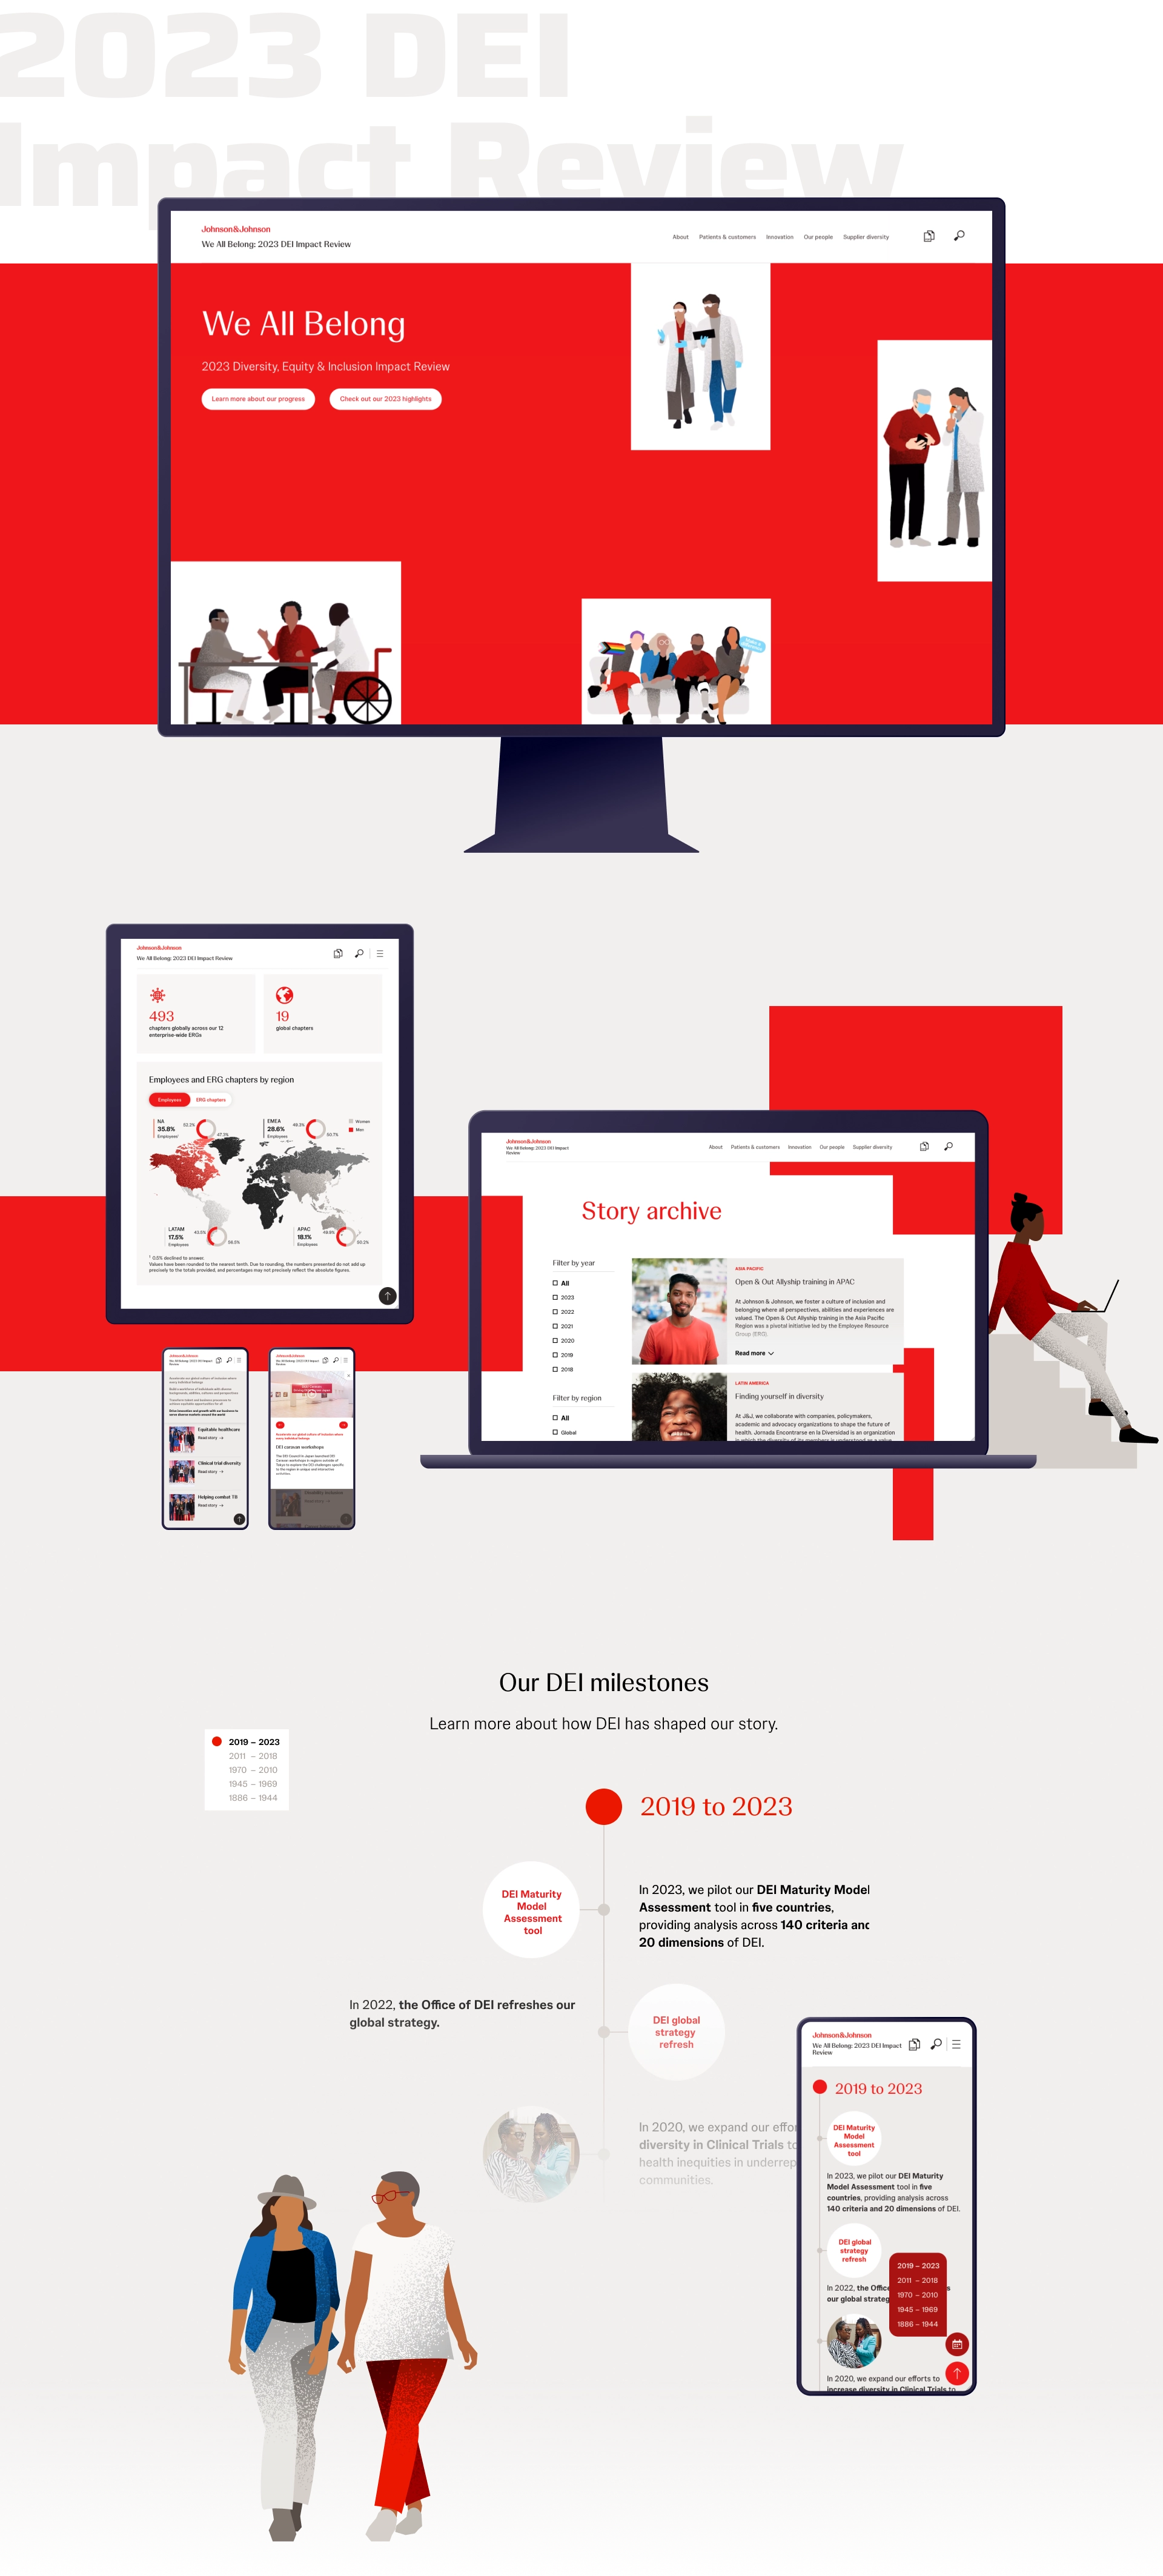
Landing page
Striking red design elements give the page a concise visual presence that catches the eye immediately. The informative CEO video provides a comprehensive overview of the most important developments of the year. The “Quick links” section allows the users to jump directly to the topics of their interest.
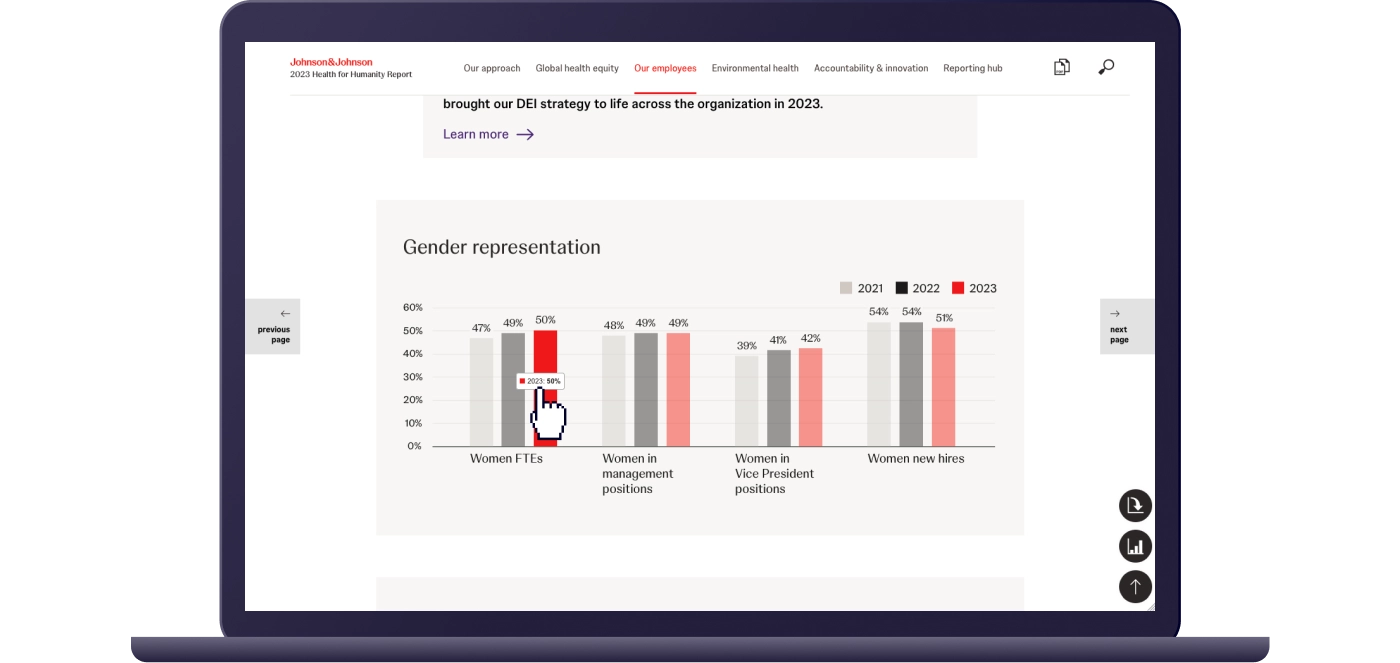
Interactive and accessible information
nexxar designed interactive infographics that are clickable, making complex facts and information, such as the ESG strategy, easily understandable and accessible – all that, of course, in a responsive way, regardless of the screen size. We place great value on accessibility not only when it comes to infographics but throughout the whole report: all photos and graphics are provided with alternative texts, the source code is kept clean so that all elements of a page can be processed by a screen reader, and users can navigate through the reports with their keyboards.

Animated key figures
To draw the attention of the users, nexxar animated the most important key figures throughout the report. Whether it’s a bar or a pie chart, numbers count up and icons load when entering the viewport.
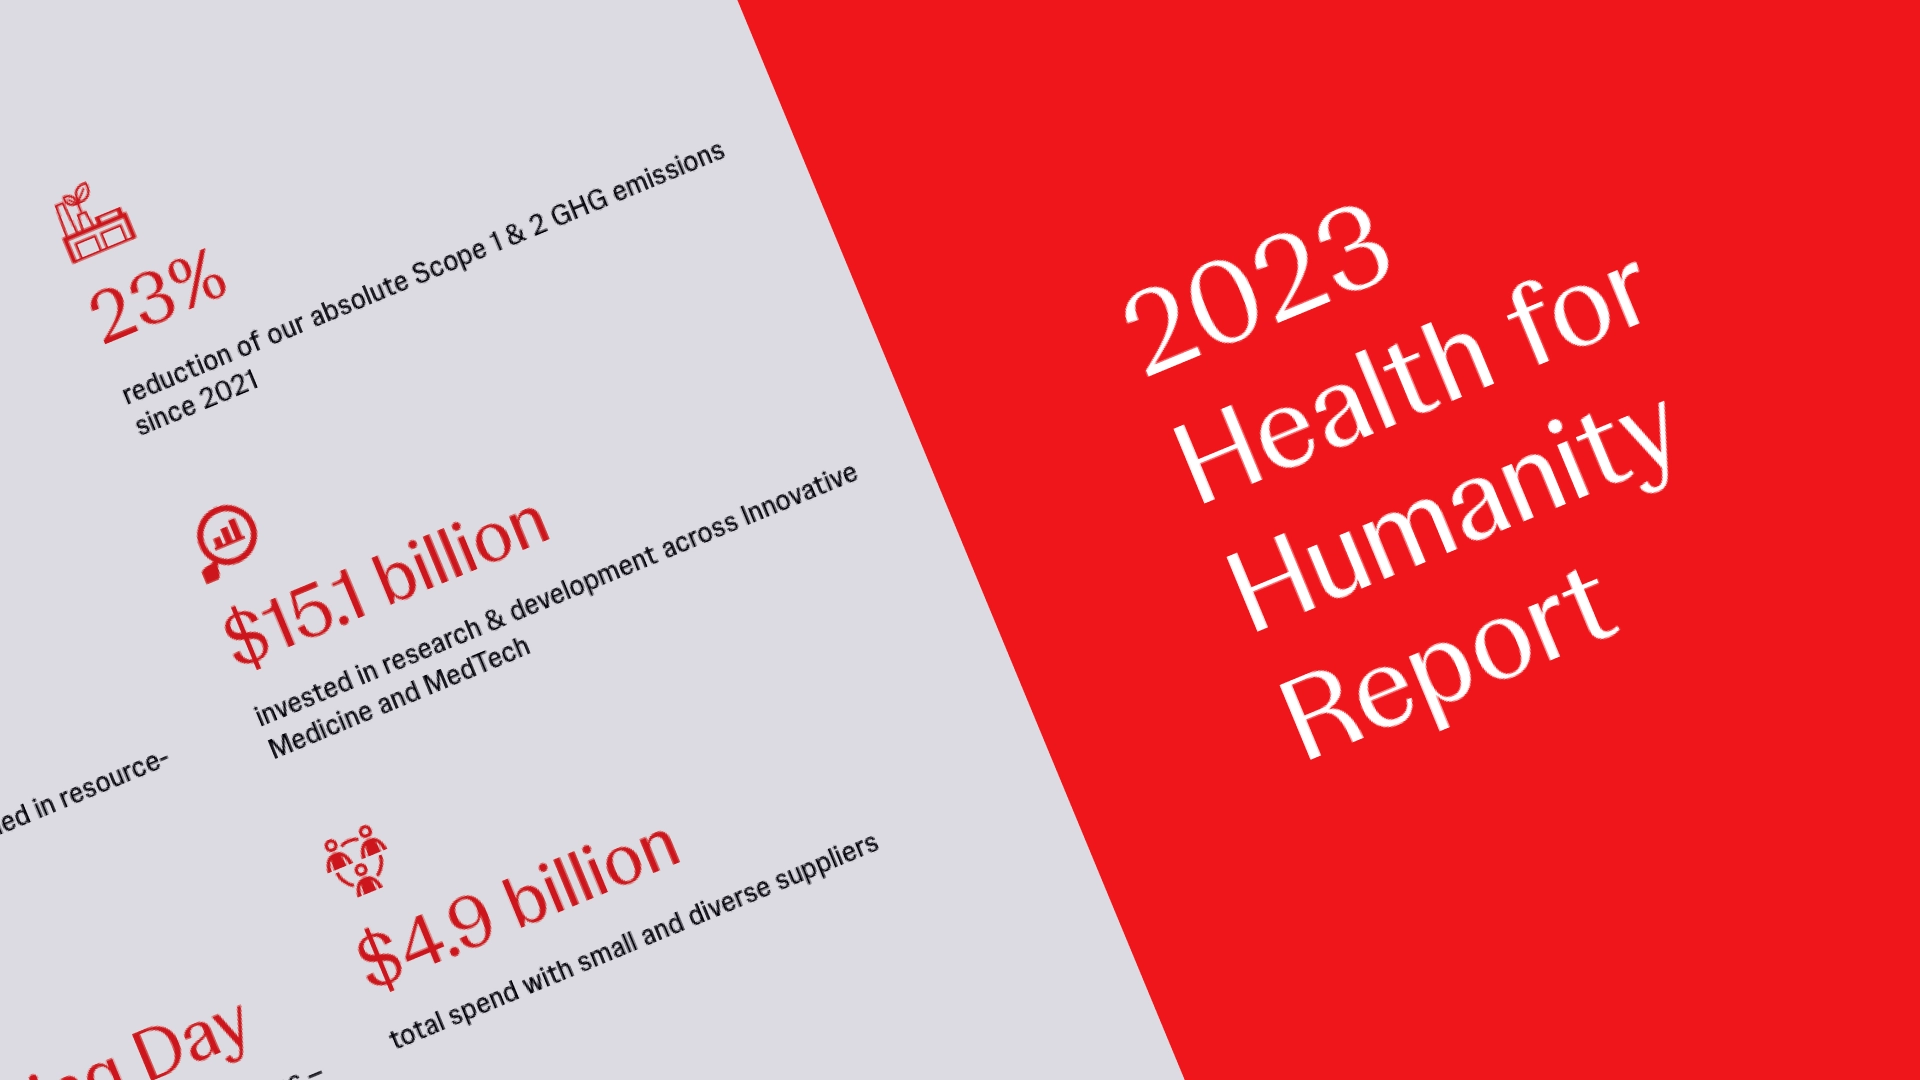
PDF supplementing the online report
This year for the first time, nexxar created both the PDF and the online version of the HFH Report. The PDF has a landscape format including many pictures, appealing graphics, interactive links and a clickable table of content that accompanies the user on every page.